The Importance of Kinetic Curves in Bioluminescence Imaging
by Katharine Martin

by Katharine Martin
Many factors affect light emission in bioluminescence imaging (BLI), which is why creating a kinetic curve is so important for experimental accuracy and reproducibility. But what is a kinetic curve? What factors impact your signal? How do you generate a kinetic curve? Keep reading to find all your answers here, or use the content list to navigate to exactly what information you’re looking for.
What is an enzymatic kinetic curve?
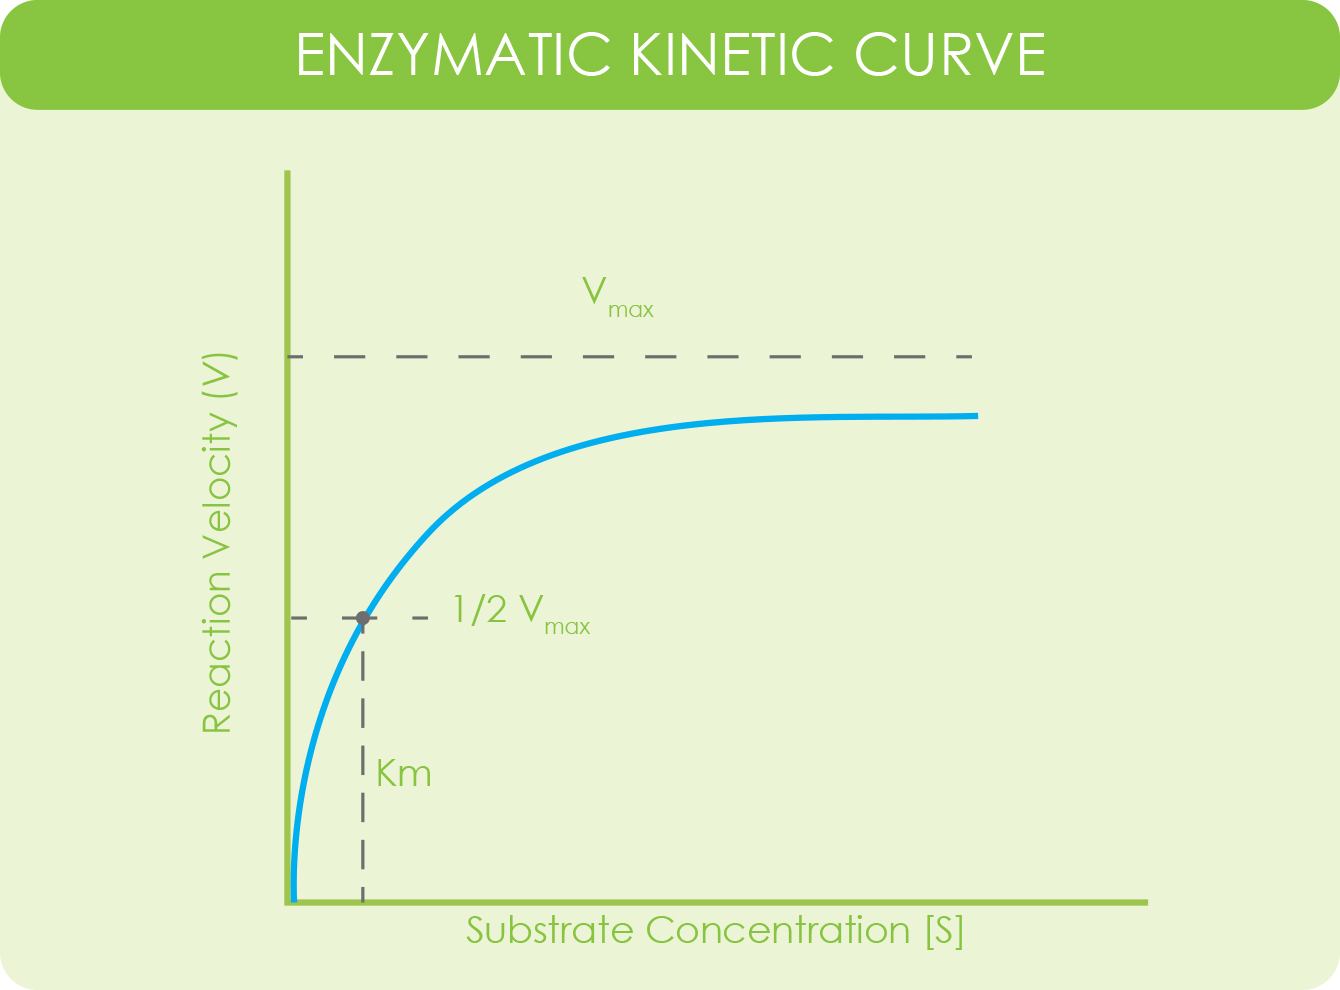
Michaelis-Menten equation and general enzymatic kinetic curve.
What is a kinetic curve in bioluminescence imaging?
Why a kinetic curve is essential for bioluminescence imaging
What factors impact bioluminescent signaling?
How to generate a kinetic curve for bioluminescence imaging
An enzymatic kinetic curve is a way of studying the rate of an enzymatic reaction given changes in components of a reaction. Usually those changes have to do with substrate concentration.
The values use the Michaelis-Menten equation and are plotted on a chart where the Y-axis represents the velocity of the reaction and the X-axis represents substrate reaction (Atkins Lab, n.d.).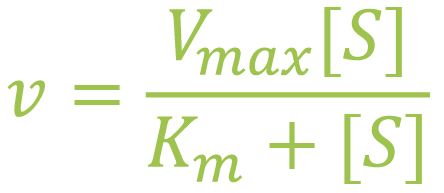
Vmax is the maximum velocity of the system when the substrate is at maximum concentration. [S] is substrate concentration. Km is substrate concentration when the velocity of the enzyme reaction is at ½ of Vmax.
A kinetic curve for luciferase activity within your experimental model is used to identify the time point at which peak emission and signal plateau occurs. You can consider the kinetic curve of luciferin-luciferase as a “time-signal intensity curve (Yang et al., 2016).” Data from a kinetic curve help researchers determine the best time point, after substrate injection, to image their subject.
In bioluminescence imaging, the kinetic curve is generated by taking a series of measurements that measure signal intensity. These measurements occur over the course of multiple time points, plotting intensity in relation to time after injection.
While the luciferin-luciferase reaction is an enzymatic reaction, the kinetic curve used for bioluminescence imaging looks different from the plot generated by the Michaelis-Menten equation.
Rather than plotting reaction velocity and substrate concentration, the curve for light emission kinetics in bioluminescence imaging plots light emission, in terms of relative light units, on the Y-axis and time, in minutes, on the X-axis.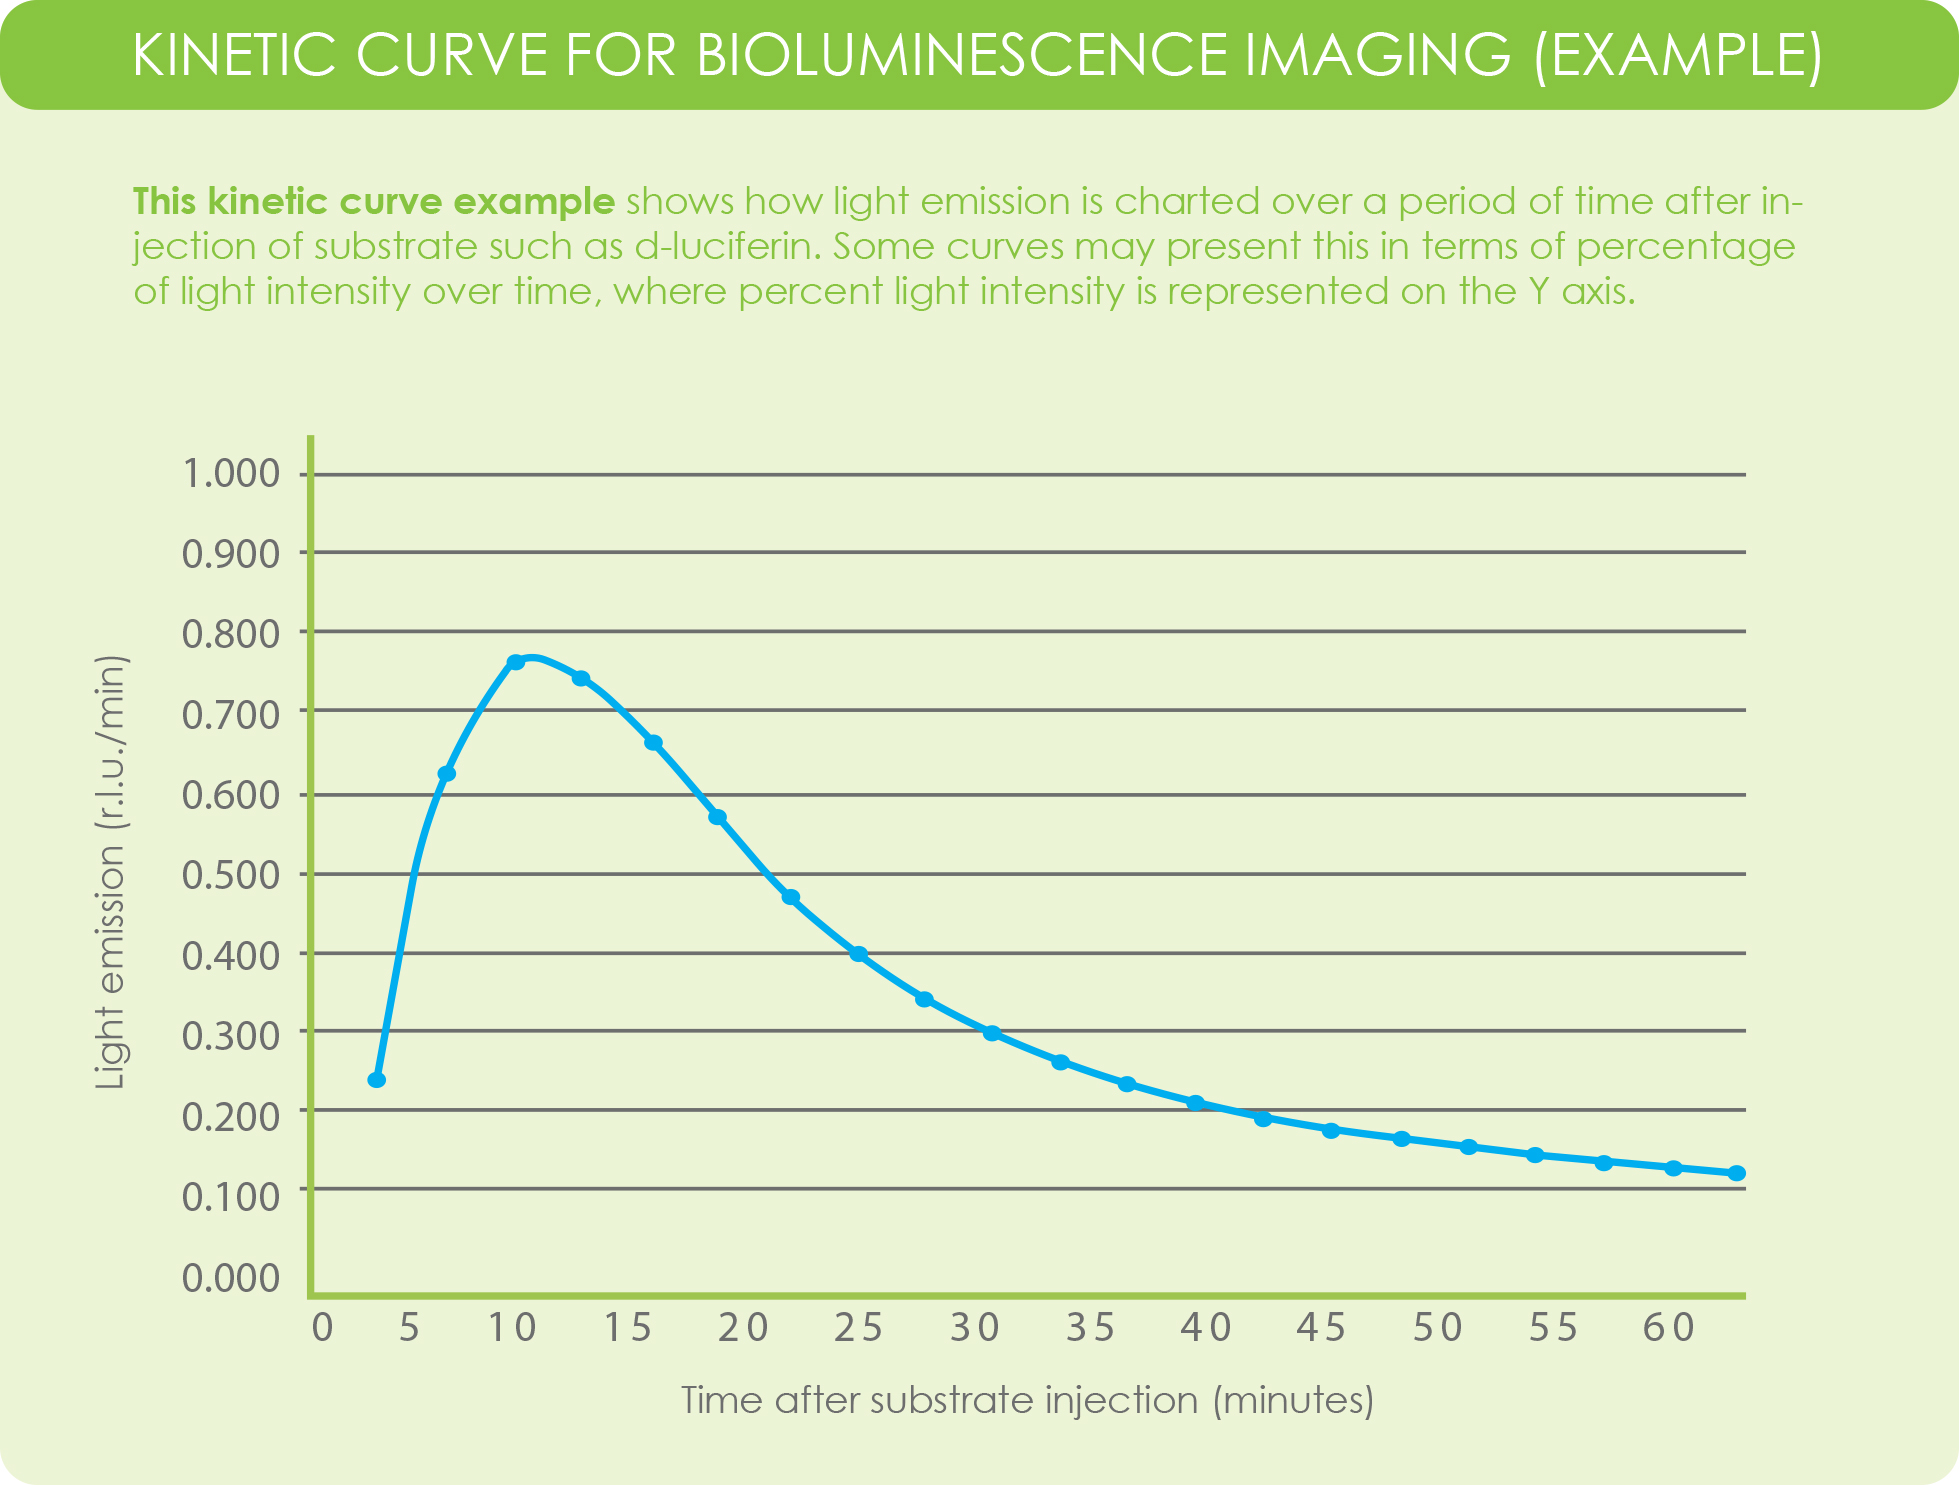
Some imaging acquisition software programs may plot kinetics based on percentage of light intensity versus time, where light intensity is represented on the Y-axis.
Ultimately, kinetic curves for bioluminescence imaging provides a way to visually identify the period after substrate injection where peak emission and plateau occurs. This insight informs researchers about the most optimal time point to image their subjects after substrate injection.
So many factors can affect the kinetics of a bioluminescent signal. Because each experiment has its own unique setup (tumor location, size, experimental application, model used, etc.), it is critical for reproducibility and accuracy to identify peak signaling time.
Many factors influence bioluminescent emissions. Below are listed some considerations. But don’t let this intimidate you during your experiment. Taking it one step at a time, and conducting a kinetic curve when anything changes will ensure optimization, reproducibility and overall BLI success (Sim, Bibee, Wickline, & Sept, 2011), (Sadikot & Blackwell, 2005).
Generating your kinetic curve depends a lot on the system you’re using for image acquisition as well as the software you’re using for analysis.
Some instruments have sequence programs that can be set in order to generate images for a kinetic curve, which can be further analyzed using imaging software.
Our In Vivo Luciferin Handbook details methods for determining a kinetic curve along with a lot of other helpful information and protocols for in vivo imaging. However, we will provide those instructions here as well.
To generate a kinetic curve for luciferase activity in your model:
Inject luciferin via one of the proposed methods listed below (Intraperitoneal, Intravenous, or Subcutaneous). If you need to sedate the animals before injection, be aware that it may slightly extend the kinetics (peak luciferase expression time). The biodistribution of luciferin may also be different depending on the route of administration.
Continue to take images every 5-10 minutes up to about 40-60 minutes for IP or SQ injected models (for IV injected models: image every 1-5 minutes up to 20-30 minutes) to generate a kinetic curve for luciferase expression in your model. (Most injectable anesthesia will last 20-30 minutes and might require an additional dose for a full kinetic curve study!)
Choose the best time point to image your model from your kinetic curve. Many models reach their peak signal time approximately 10-20 minutes post IP or SQ luciferin injection and 2-5 minutes post IV luciferin injection.
Atkins Lab. (n.d.). Michaelis-Menten Kinetics and Briggs-Haldane Kinetics. Retrieved September 24, 2020, from https://depts.washington.edu/wmatkins/kinetics/mic...
Baert, A. (Ed.). (1970, January 01). Time‐signal Intensity Curve (TIC). Retrieved September 24, 2020, from https://link.springer.com/referenceworkentry/10.10...
Burgos, J., Rosol, M., Moats, R., Khankaldyyan, V., Kohn, D., Nelson, M., & Laug, W. (2003, June). Time course of bioluminescent signal in orthotopic and heterotopic brain tumors in nude mice. Retrieved September 24, 2020, from https://www.ncbi.nlm.nih.gov/pubmed/12813886
Dai, Y., Chen, D., Wang, G., Yin, J., Zhan, Y., Wu, K., . . . Chen, X. (2020, February). Kinetic modeling and analysis of dynamic bioluminescence imaging of substrates administered by intraperitoneal injection. Retrieved September 24, 2020, from https://www.ncbi.nlm.nih.gov/pmc/articles/PMC70632...
Inoue, Y., Kiryu, S., Watanabe, M., Tojo, A., & Ohtomo, K. (2010). Timing of imaging after d-luciferin injection affects the longitudinal assessment of tumor growth using in vivo bioluminescence imaging. Retrieved September 24, 2020, from https://www.ncbi.nlm.nih.gov/pmc/articles/PMC29104...
Sadikot, R., & Blackwell, T. (2005). Bioluminescence imaging. Retrieved September 21, 2020, from https://www.ncbi.nlm.nih.gov/pmc/articles/PMC27133...
Sim, H., Bibee, K., Wickline, S., & Sept, D. (2011, February 1). Pharmacokinetic modeling of tumor bioluminescence implicates efflux, and not influx, as the bigger hurdle in cancer drug therapy. Retrieved September 24, 2020, from https://www.ncbi.nlm.nih.gov/pmc/articles/PMC30737...
Yang, S., Li, F., Chen, J., Zhang, G., Liao, Y., & Huang, T. (2016, April 7). Kinetic Curve Type Assessment for Classification of Breast Lesions Using Dynamic Contrast-Enhanced MR Imaging. Retrieved September 24, 2020, from https://www.ncbi.nlm.nih.gov/pmc/articles/PMC48244...

The interaction between the small molecule biotin and the protein streptavidin is incredibly strong and has been co-opted for numerous biotechnological purposes. For example, by...

The protein streptavidin clamps onto the small molecule biotin in one of the tightest natural interactions ever discovered. Over the years, the strength of this...

Maybe you are about to start working with D-luciferin, and you begin reviewing protocols. But what you’re doing is a little different. Or what you...

Handles are common in everyday life. We use them to help us open doors, cabinets, or to hold coffee mugs, cookware, and tools. They are...


